
Kód: 14429887
Pro Tableau
Autor Seema Acharya, Subhashini Chellappan
The book will discuss the significance of Visualization in Business Intelligence and Data Science Using Tableau. It will explore the power of statistics and data mining to help with the understanding of data and make compelling da ... celý popis
- Jazyk:
 Angličtina
 - Vazba: Brožovaná
- Počet stran: 845
Nakladatelství: APress, 2016
- Více informací o knize

Mohlo by se vám také líbit
-

Learning Tableau
1532 Kč -
Practical Tableau
1524 Kč -

Mastering Tableau 2021
2754 Kč -
Communicating Data with Tableau
1174 Kč -

2010
249 Kč -

On The Edge
306 Kč -

The Four Agreements
290 Kč -

Primal Blueprint
543 Kč -

Raw: A Real-Life Bible Study for Teen Girls
470 Kč -

Clover Moon
252 Kč -

Nikola Tesla
655 Kč -

Final Scrum
614 Kč -

Why Buddhism Is True
276 Kč -

Power BI - Business Intelligence Clinic
707 Kč -

The World's Worst Parents
378 Kč -

No Bad Parts
476 Kč -

Influence
505 Kč -

World's Worst Pets
378 Kč -

Microsoft Power BI Quick Start Guide - Third Edition
1168 Kč -

A Manual of Zoology
1124 Kč -

Habibi
913 Kč -

Stolen
268 Kč -

Understanding Probability
1523 Kč -

Inspiration 1 Builder
890 Kč -

OPC Unified Architecture
2204 Kč -

OPC Unified Architecture
2108 Kč -

Artistic Truth
1212 Kč -

Herb Brooks
393 Kč -

The Culture Map
594 Kč -

Human Story
356 Kč -

Lactose-Derived Prebiotics
6741 Kč -

BJ Alex 01
407 Kč -

Ruta Tannenbaum
539 Kč -

Grošák
144 Kč -

Tvoje vina
290 Kč -

Prapsi
159 Kč -

Harry Potter y la piedra filosofal
318 Kč -

Wieso? Weshalb? Warum? junior, Band 34: Der Traktor
294 Kč -

Grafitové děvče
209 Kč -

Chorvatsko
262 Kč -

Praga Piccola
281 Kč -

Aeneis
570 Kč
Darujte tuto knihu ještě dnes
- Objednejte knihu a zvolte Zaslat jako dárek.
- Obratem obdržíte darovací poukaz na knihu, který můžete ihned předat obdarovanému.
- Knihu zašleme na adresu obdarovaného, o nic se nestaráte.
Více informací o knize Pro Tableau
Nákupem získáte 194 bodů
 Anotace knihy
The book will discuss the significance of Visualization in Business Intelligence and Data Science Using Tableau. It will explore the power of statistics and data mining to help with the understanding of data and make compelling dashboards to enable quicker decision making. The book will encourage self-service BI by placing power directly in the hands of business users. It will be intuitive enough to help pull together good visualization quickly yet leave room for deeper exploration. The book will cover the connectivity to varied data sources such as spreadsheets (Excel), text files (.txt), MS access databases (.accdb), RDBMSs (MS SQL Server, Oracle, MySQL), NoSQL (MongoDB, Cassandra), Big Data (Cloudera Hadoop), R Scripts (.rdata), etc. The book will have detailed steps on connecting to single and multiple (similar and disparate) data sources. The book will discuss several types of charts (bar, stacked bar, combination charts, dual axis charts, area charts, bubble charts, heat maps, tree maps, highlight tables, pie charts, histogram, box and whisker plot, etc). The book will have a complete section dedicated to data mining. This will be covered by bringing together R analytics with Tableau. The power of visual analytics to tell a compelling story will be discussed with a couple of good use cases. What you will learn: -How to connect various data sources such as structured RDBMS (SQL Server, Oracle), non-relational databases (NoSQL such as MongoDB, Cassandra), multi-dimensional data structure (cube in SSAS), and also write your own custom SQL, etc. -How to Perform logistics regression and statistical analysis in tableau using R -How to Integrate Tableau with R -Telling a meaningful story with data by creating highly interactive dashboards Who this book is for: The audience for this book includes all levels of IT professionals, from executives responsible for determining IT strategies to systems administrators, to data analysts, to decision makers responsible for driving strategic initiatives, etc. It will help to chart your journey from a novice to a professional visualization expert.
 Parametry knihy
Zařazení knihy Knihy v angličtině Computing & information technology Computer programming / software development Database programming
1939 Kč
- Plný název: Pro Tableau
- Autor: Seema Acharya, Subhashini Chellappan
- Jazyk:
 Angličtina
 - Vazba: Brožovaná
- Počet stran: 845
- EAN: 9781484223512
- ISBN: 1484223519
- ID: 14429887
- Nakladatelství: APress
- Hmotnost: 1584 g
- Rozměry: 254 × 178 × 45 mm
- Datum vydání: 24. December 2016
Oblíbené z jiného soudku
-
SQL Cookbook
1266 Kč -

Microsoft SQL Server 2016: A Beginner's Guide, Sixth Edition
1262 Kč -

Getting Started with SQL
879 Kč -

Oracle PL/SQL Best Practices 2e
616 Kč -

Pro T-SQL Programmer's Guide
3079 Kč -

Murachs Oracle SQL & Pl / SQL for Developers
1302 Kč -

Geoprocessing with Python
1595 Kč -

Oracle PL/SQL For Dummies
671 Kč -

Oracle Database 12c PL/SQL Advanced Programming Techniques
1595 Kč -

Head First SQL
1209 Kč -

Joe Celko's SQL for Smarties
2115 Kč -
SQL Tuning
954 Kč -

NoSQL For Dummies
688 Kč -

Pro LINQ in VB8
1041 Kč -

Real World SQL and PL/SQL: Advice from the Experts
1512 Kč -

Oracle Database 11g PL/SQL Programming
1491 Kč -

Formal SQL Tuning for Oracle Databases
1595 Kč -

SQL Queries for Mere Mortals
1111 Kč -
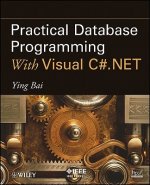
Practical Database Programming With Visual C#.NET
3758 Kč -

Guerrilla Analytics
1478 Kč -

Microsoft SQL Server 2016 Reporting Services, Fifth Edition
1378 Kč -

Joe Celko's Trees and Hierarchies in SQL for Smarties
950 Kč -

Microsoft SQL Server 2005 Stored Procedure Programming in T-SQL & .NET
1423 Kč -

Pro SQL Server Always On Availability Groups
2673 Kč -

SQL in Easy Steps
374 Kč -

Essential SQLAlchemy, 2e
1219 Kč -

SQL Server Query Performance Tuning Distilled
1378 Kč -

Pro SQL Server Reporting Services
929 Kč -

Art of SQL
1265 Kč -
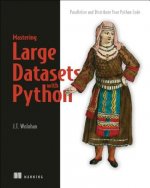
Mastering Large Datasets
1474 Kč -

Learning SQL
1173 Kč -
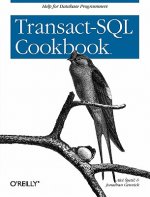
Transact-SQL Cookbook
1174 Kč -
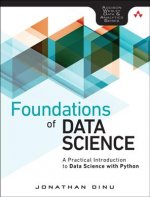
Foundations of Data Science
1160 Kč -

Oracle PL/SQL
2314 Kč -

SQL Bible 2e
1378 Kč -

SQL: A Beginner's Guide
862 Kč -

Expert PHP and MySQL
1665 Kč -

Pervasive Computing
4190 Kč -

Modern B-Tree Techniques
2729 Kč -

DevOps, DBAs, and DBaaS
1892 Kč -

Joe Celko's SQL Puzzles and Answers
2211 Kč -

Effective SQL
1406 Kč -

SQL Primer
1314 Kč -

Big Data Analytics and Knowledge Discovery
1665 Kč -

Extending SSIS with .NET Scripting
2782 Kč -

Joe Celko's Analytics and OLAP in SQL
1863 Kč -

Dissecting SQL Server Execution Plans
705 Kč -
MongoDB Recipes
1041 Kč -

Oracle PL/SQL for DBAs
1041 Kč
Osobní odběr Praha, Brno a 12903 dalších
Copyright ©2008-24 nejlevnejsi-knihy.cz Všechna práva vyhrazenaSoukromíCookies


 Vrácení do měsíce
 571 999 099 (8-15.30h)