Kód: 08021351
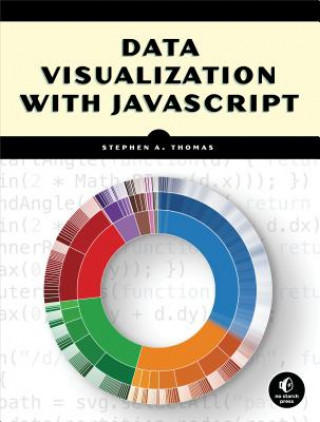
Data Visualization With Javascript
Autor Stephen Thomas
A well-designed data visualization makes information clear and captivating. Using color, animation, and interactive features, these graphics can make data come alive. Data Visualization with JavaScript shows you how to use a wide ... celý popis
- Jazyk:
 Angličtina
 - Vazba: Brožovaná
- Počet stran: 384
Nakladatelství: No Starch Press,US, 2015
- Více informací o knize

1239 Kč
Dostupnost:
50 % šance Máme informaci, že by titul mohl být dostupný. Na základě vaší objednávky se ho pokusíme do 6 týdnů zajistit.
Prohledáme celý svět
Mohlo by se vám také líbit
-

Brand Protection Online
5797 Kč -

Learn CSS in One Day and Learn It Well (Includes Html5)
354 Kč -

Iron Kingdom
483 Kč -

Proposals for Printing a Very Curious Discourse, in Two Volumes in Quarto, Intitled Pseudologia Politike
449 Kč -

Five Minutes Answer to Paine's Letter to Genl. Washington.
429 Kč -

Mystery of M. Felix. a Novel.
673 Kč -

American Overstretch and the End of Hegemony
1646 Kč
Darujte tuto knihu ještě dnes
- Objednejte knihu a zvolte Zaslat jako dárek.
- Obratem obdržíte darovací poukaz na knihu, který můžete ihned předat obdarovanému.
- Knihu zašleme na adresu obdarovaného, o nic se nestaráte.
Informovat o naskladnění knihy
Zadejte do formuláře e-mailovou adresu a jakmile knihu naskladníme, zašleme vám o tom zprávu. Pohlídáme vše za vás.
Více informací o knize Data Visualization With Javascript
Nákupem získáte 124 bodů
 Anotace knihy
A well-designed data visualization makes information clear and captivating. Using color, animation, and interactive features, these graphics can make data come alive. Data Visualization with JavaScript shows you how to use a wide range of JavaScript tools and libraries to make effective data visualizations. In Data Visualization with JavaScript, author Stephen A. Thomas takes you through all the design principles and programming techniques you need to start building your own data visualizations for your website-from the basic line chart to fully interactive network graphs and animated maps. Thomas provides full color, step-by-step instructions for creating specialized web graphics, such as charts that display stock market details in response to mouse movements, and a map that animates train routes to show the fastest option. Inside you'll also learn how to: Make charts that respond to user actions like mouse movements, clicks, zooming, and scrolling. Use an AJAX service to dynamically retrieve data for a chart Choose the right kind of visualization for a particular data set, and integrate the graphic into your website Pick the right tool for your visualization, from easy-to-use web components with everything built in, to powerful, highly customizable libraries like D3.js Manage large data sets in the web browser using Underscore.js Integrate data visualizations into a full web application No matter what your experience level as a web developer, Data Visualization with JavaScript will have you building beautiful and effective data visualizations in no time.
 Parametry knihy
Zařazení knihy Knihy v angličtině Computing & information technology Computer programming / software development Web programming
1239 Kč
- Plný název: Data Visualization With Javascript
- Autor: Stephen Thomas
- Jazyk:
 Angličtina
 - Vazba: Brožovaná
- Počet stran: 384
- EAN: 9781593276058
- ISBN: 1593276052
- ID: 08021351
- Nakladatelství: No Starch Press,US
- Hmotnost: 866 g
- Rozměry: 180 × 238 × 32 mm
- Datum vydání: 15. March 2015
Oblíbené z jiného soudku
-

Eloquent Javascript, 3rd Edition
857 Kč -

Spring Boot in Action
806 Kč -

CSS Pocket Reference
573 Kč -

D3.js for the Impatient
1001 Kč -

Microservice Patterns
1225 Kč -

API Testing and Development with Postman
1337 Kč -

Effective Java
1097 Kč -

Fluent Python
1472 Kč -

Java Concurrency in Practice
1284 Kč -

Beyond The Basic Stuff With Python
708 Kč -

Introduction to Machine Learning with Python
1316 Kč -

Python for Microcontrollers: Getting Started with MicroPython
553 Kč -

Definitive Guide to HTML5 WebSocket
1778 Kč -

Perl Pocket Reference 5e
248 Kč -

Gray Hat Python
891 Kč -

PHP 8 Programming Tips, Tricks and Best Practices
1566 Kč -

Mastering JavaFX 8 Controls
885 Kč -

Learning Cocoa with Objective-C 4ed
824 Kč -

Building Microservices
1453 Kč -

HTML & CSS: Design and Build Websites
571 Kč -

Monolith to Microservices
1050 Kč -

Modern Java in Action
1326 Kč -

Effective Python
1059 Kč -

Serious Python
731 Kč -

CSS Secrets
866 Kč -

Pro Angular
1473 Kč -

JavaScript from Beginner to Professional
1040 Kč -

Learning Python
1405 Kč -

JavaScript and JQuery - Interactive Front-End Web Development
776 Kč -

Effective TypeScript
1300 Kč -

JavaScript : The Good Parts
577 Kč -

Programming TypeScript
1043 Kč -

REST API Design Rulebook
562 Kč -

OCA / OCP Java SE 8 Programmer Practice Tests
825 Kč -

Kotlin Design Patterns and Best Practices
1154 Kč -

RESTful Web APIs
1072 Kč -

HTML & CSS - Design and Build Websites
1020 Kč -

Practical JIRA Administration
515 Kč -

Vert.x in Action
1264 Kč -

Optimizing Java
1719 Kč -

Domain-Driven Design in PHP
1285 Kč -

Murachs Java Servlets & JSP
1335 Kč -

Architecting Angular Applications with Redux, RxJS, and NgRx
1256 Kč -

Vue.js - Up and Running
996 Kč -

Python For Kids For Dummies
620 Kč -

Beginning Git and GitHub
1524 Kč -

Pro Python
1021 Kč -

XSLT Cookbook 2e
1097 Kč -

IntelliJ IDEA Essentials
1398 Kč
Osobní odběr Praha, Brno a 12903 dalších
Copyright ©2008-24 nejlevnejsi-knihy.cz Všechna práva vyhrazenaSoukromíCookies


 Vrácení do měsíce
 571 999 099 (8-15.30h)