Kód: 09269140
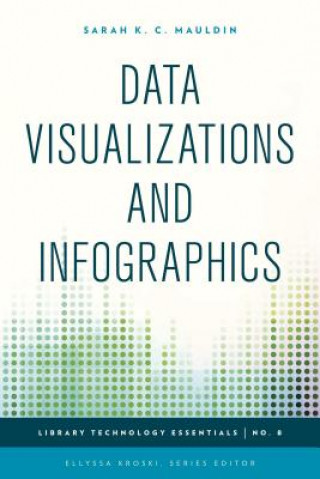
Data Visualizations and Infographics
Autor Sarah K. C. Mauldin
Graphics which visually represent data or complex ideas are oftentimes easier for people to understand and digest than standalone statistics. A map shaded with different colors to represent religious affiliations or income levels ... celý popis
- Jazyk:
 Angličtina
 - Vazba: Brožovaná
- Počet stran: 134
Nakladatelství: Rowman & Littlefield, 2015
- Více informací o knize

Mohlo by se vám také líbit
-

Augmented and Virtual Reality in Libraries
1735 Kč -
Data Visualization
3447 Kč -

Graphic Design
2468 Kč -

Digital Curation Projects Made Easy
1353 Kč -

Elements of Information Organization and Dissemination
3232 Kč -

Cultural Heritage Infrastructures in Digital Humanities
5255 Kč -

Information Graphics
2851 Kč -

Classification and Data Mining
2998 Kč -

Orthodox Christianity Reasonable Faith
396 Kč -

GIS for Planning and the Built Environment
6185 Kč -

Role of Information Professionals in the Knowledge Economy
2133 Kč -

Human Ear
312 Kč -

Truthful Art, The
1166 Kč -

Tissue Cleansing Through Bowel Management
361 Kč -

Master the Wards: Internal Medicine Handbook, Third Edition
1497 Kč -

Visual Content Marketing
705 Kč -
Wall Street Journal Guide to Information Graphics
598 Kč -

Strategieentwicklung für Unternehmensfunktionen
1167 Kč -

Test di prestazione di Applicazioni Web
1837 Kč -

Communaute En Ligne de Co-Creation d'Experience Touristique
2487 Kč -

Milujte sa s láskou
274 Kč
Dárkový poukaz: Radost zaručena
- Darujte poukaz v libovolné hodnotě a my se postaráme o zbytek.
- Poukaz se vztahuje na celou naši nabídku.
- Elektronický poukaz vytisknete z e-mailu a můžete ihned darovat.
- Platnost poukazu je 12 měsíců od data vystavení.
Více informací o knize Data Visualizations and Infographics
Nákupem získáte 193 bodů
 Anotace knihy
Graphics which visually represent data or complex ideas are oftentimes easier for people to understand and digest than standalone statistics. A map shaded with different colors to represent religious affiliations or income levels enables researchers to quickly identify trends and patterns. New free tools and applications offer librarians the opportunity to organize and manipulate data to quickly create these helpful graphics. Learn how to overlay data sets on maps, create infographics for library services and instruction, use mindmapping for group brainstorming sessions, produce detailed timelines, process flowcharts, diagrams, and much more in this complete how-to-guidebook. This complete how-to guidebook provides you with the tools and inspiration you need to use infographics and data visualization techniques in your library to knock your audience's socks off as you tell your story in a visual format that can be consumed and understood at a glance. Readers will learn how to implement projects such as: *Use the Tools You Already Have to Create a Simple Infographic *Using Microsoft Word *Creating a Library Services Infographic Using Piktochart *Creating Instructional Infographics with Easel.ly *Creating an Interactive Historical Timeline Two Ways *Mindmapping Your Brainstorming Meetings *Creating Library Website Flowcharts and Diagrams Using Creately *Creating Interactive Maps with Imported Data *Creating Complex Data Visualizations
 Parametry knihy
Zařazení knihy Knihy v angličtině Reference, information & interdisciplinary subjects Library & information sciences Library & information services
1926 Kč
- Plný název: Data Visualizations and Infographics
- Autor: Sarah K. C. Mauldin
- Jazyk:
 Angličtina
 - Vazba: Brožovaná
- Počet stran: 134
- EAN: 9781442243873
- ISBN: 1442243872
- ID: 09269140
- Nakladatelství: Rowman & Littlefield
- Hmotnost: 214 g
- Rozměry: 230 × 152 × 16 mm
- Datum vydání: 15. August 2015
Oblíbené z jiného soudku
-

Strategic Planning for Academic Libraries
1808 Kč -

Mentoring A-Z
1894 Kč -

New Bodleian - Making the Weston Library
965 Kč -

Innovation in Public Libraries
2562 Kč -

Trinity College Library Dublin
911 Kč -

Post-Pandemic Library Handbook
1430 Kč -

Emerging Library Technologies
2562 Kč -

Expert Internet Searching
2515 Kč -

Serving Those Who Served
1959 Kč -

Mentoring and Managing Students in the Academic Library
1798 Kč -

Exhibits and Displays
2245 Kč -

End of Wisdom?
1646 Kč -

Innovative School Librarian
2843 Kč -

Media and Information Literacy in Higher Education
2562 Kč -

Makerspaces in Libraries
1926 Kč -

Distributed Learning
3233 Kč -

Museum Librarianship
1798 Kč -

Promise of Cultural Institutions
1735 Kč -

Young Adult Literature
2034 Kč -

Marketing for Special and Academic Libraries
3137 Kč -

Picture Books for Children
1639 Kč -

Digital Paper
750 Kč -

Infographics
2723 Kč -

Google and the Digital Divide
1836 Kč -

Collecting Shakespeare
1088 Kč -

Partnerships and New Roles in the 21st-Century Academic Library
3776 Kč -

Organizing Exhibitions
3060 Kč -

Google Scholar and More
1666 Kč -

Remote Capture
918 Kč -

Repositioning Reference
2053 Kč -

Facelifts for Special Libraries
1680 Kč -

Programming for Adults
2819 Kč -

Creative Management of Small Public Libraries in the 21st Century
3870 Kč -

Guide Reference
2118 Kč -

Creating and Promoting Lifelong Learning in Public Libraries
3776 Kč -

Nonchemical Treatment Processes for Disinfestation of Insects and Fungi in Library Collections
4771 Kč -

Improving Student Information Search
1865 Kč -

Marketing and Outreach for the Academic Library
1926 Kč -

Books in Motion
1798 Kč -

Fee-Based Services in Library and Information Centres
1103 Kč -

Medical Library Association Guide to Data Management for Librarians
5179 Kč -

Developing Digital Scholarship
2625 Kč -

Strong Future for Public Library Use and Employment
3146 Kč -

Academic Library Administrator's Field Guide
2277 Kč -

Rethinking Reference for Academic Libraries
3488 Kč -

Going Beyond Loaning Books to Loaning Technologies
2723 Kč -

Systematic Searching
3169 Kč -

Role of the Electronic Resources Librarian
2595 Kč -

Working Remotely
2118 Kč
Osobní odběr Praha, Brno a 12903 dalších
Copyright ©2008-24 nejlevnejsi-knihy.cz Všechna práva vyhrazenaSoukromíCookies


 Vrácení do měsíce
 571 999 099 (8-15.30h)