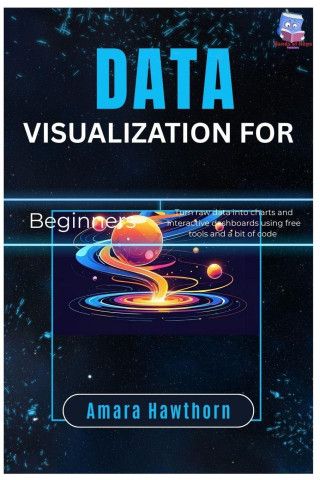
Kód: 50721092
Data Visualization for Beginners
Autor AMARA Hawthorn
Do you struggle to make sense of spreadsheets full of numbers? What if you could turn raw data into stunning visuals and interactive dashboards-without expensive software or advanced coding skills?This beginner-friendly guide show ... celý popis


- Jazyk:
 Angličtina
- Vazba: Brožovaná
- Počet stran: 184
Nakladatelství: Independently published, 2025
- Více informací o knize


Mohlo by se vám také líbit





Dárkový poukaz: Radost zaručena
- Darujte poukaz v libovolné hodnotě a my se postaráme o zbytek.
- Poukaz se vztahuje na celou naši nabídku.
- Elektronický poukaz vytisknete z e-mailu a můžete ihned darovat.
- Platnost poukazu je 12 měsíců od data vystavení.
Více informací o knize Data Visualization for Beginners
Nákupem získáte 43 bodů
 Anotace knihy

Do you struggle to make sense of spreadsheets full of numbers? What if you could turn raw data into stunning visuals and interactive dashboards-without expensive software or advanced coding skills?
This beginner-friendly guide shows you how to transform messy data into clear, powerful insights. Whether you're a student, small business owner, researcher, or simply curious about data, you'll learn step by step how to create professional-looking charts, graphs, and dashboards using free tools and simple code snippets anyone can understand.
Inside, you'll discover:
How to clean and prepare raw data for visualization
The best free tools (like Google Data Studio, Tableau Public, and Python libraries) to get started fast
Easy techniques for creating bar charts, line charts, scatterplots, heatmaps, and more
How to design dashboards that make data interactive and engaging
Real-world projects you can follow along with-no prior experience needed!
By the end of this book, you'll have the confidence to turn numbers into stories and data into decisions. You don't need to be a programmer or statistician-just a willingness to explore and experiment.
Parametry knihy
434 Kč
- Plný název: Data Visualization for Beginners
- Podnázev: Turn raw data into charts and interactive dashboards using free tools and a bit of code
- Autor: AMARA Hawthorn
- Jazyk: Angličtina
- Vazba: Brožovaná
- Počet stran: 184
- EAN: 9798299026429
- ID: 50721092
- Nakladatelství: Independently published
- Hmotnost: 255 g
- Rozměry: 229 × 152 × 10 mm
- Datum vydání: 08. September 2025
Oblíbené z jiného soudku
-

Threshing Day (Limited Deluxe Edition)
441 Kč -

Cozy Countdown: An Advent Coloring Book Bundle
514 Kč -

Court of Thorns and Roses 6
385 Kč -

Murdoku
327 Kč -

White Nights
82 Kč -

Trust Fall
227 Kč -

A Conspiracy of Charming Monsters
419 Kč -

I'll Believe in Anything. The Making of Heated Rivalry Season 1
473 Kč -

The Mirror of Infinite Endings
434 Kč -

A Conspiracy of Charming Monsters
276 Kč -

Once Upon a Broken Heart Collector's Edition
562 Kč -

The Long-Lived King: An Original The Owl House Graphic Novel
385 Kč -

Chainsaw Man, Vol. 22
230 Kč -

Jojo's Bizarre Adventure: Part 7--Steel Ball Run, Vol. 9
438 Kč -

Berserk Deluxe Volume 1
899 Kč -

Protocols
302 Kč -

Murdoku Volume 2: Back in Time
293 Kč -

The End of Everything
292 Kč -

21 Days of Fear
406 Kč -

Threshing Day (Wing and Claw Collection)
453 Kč -

How to Win at Chess, Next Level
506 Kč -

East of Eden
259 Kč -

Lord of Mysteries, Vol. 4: The Faceless, Part I
336 Kč -

Fourth Wing
563 Kč -

Berserk Deluxe Volume 3
799 Kč -

Witch Hat Atelier: Grimoire Edition 3
1582 Kč -

Jojo's Bizarre Adventure: Part 7--Steel Ball Run, Vol. 2
468 Kč -

The Count of Monte Cristo
227 Kč -

Witch Hat Atelier: Grimoire Edition 1
823 Kč -

Iron Flame
566 Kč -

Penguin Readers Level 4: The Adventures of Sherlock Holmes (ELT Graded Reader)
178 Kč -

The Guy She Was Interested in Wasn't a Guy at All, Vol. 4
343 Kč -

Murdle: Volume 1
293 Kč -

Witch Hat Atelier: Grimoire Edition 2
752 Kč -

Murdoku Volume 3: Around the World
350 Kč -

Dangerous Impulses, Book 5 (The Naturals)
214 Kč -

The Washwoman at the River's End
454 Kč -

Jojo's Bizarre Adventure: Part 7--Steel Ball Run, Vol. 1
468 Kč -

The Guy She Was Interested in Wasn't a Guy at All, Vol. 1
343 Kč -

Berserk Deluxe Volume 2
965 Kč -

JoJo's Bizarre Adventure: Part 7--Steel Ball Run, Vol. 3
413 Kč -

The Art of Gravity Falls
827 Kč -

Onyx Storm
227 Kč -

JoJo's Bizarre Adventure: Part 7--Steel Ball Run, Vol. 4
436 Kč -

The Courage To Be Disliked
206 Kč -

Spooky Cutie
183 Kč -

The Mirror of Infinite Endings
494 Kč -

What Happened Yesterday
359 Kč -

Jujutsu Kaisen, Vol. 26
220 Kč
Osobní odběr Praha, Brno a 48478 dalších
Copyright ©2008-26 nejlevnejsi-knihy.cz Všechna práva vyhrazenaSoukromíCookies

 Vrácení do měsíce
 571 999 099 (8-15.30h)
