Kód: 08798117
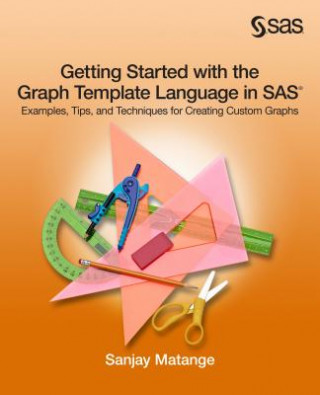
Getting Started with the Graph Template Language in SAS
Autor Sanjay Matange
You've just received a new survey of study results, and you need to quickly create custom graphical views of the data. Or, you've completed your analysis, and you need graphs to present the results to your audience, in the style t ... celý popis
- Jazyk:
 Angličtina
 - Vazba: Brožovaná
- Počet stran: 186
Nakladatelství: SAS Institute, 2013
- Více informací o knize

Mohlo by se vám také líbit
Informovat o naskladnění knihy
Zadejte do formuláře e-mailovou adresu a jakmile knihu naskladníme, zašleme vám o tom zprávu. Pohlídáme vše za vás.
Více informací o knize Getting Started with the Graph Template Language in SAS
 Anotace knihy
You've just received a new survey of study results, and you need to quickly create custom graphical views of the data. Or, you've completed your analysis, and you need graphs to present the results to your audience, in the style that they prefer. Now, you can create custom graphs quickly and easily with Getting Started with the Graph Template Language in SAS, without having to understand all of the Graph Template Language (GTL) features first. This book will get you started building graphs immediately and will guide you toward a better understanding of the GTL, one step at a time. It shows you the most common approaches to a variety of graphs along with information that you can use to build more complex graphs from there. Sanjay Matange offers expert tips, examples, and techniques, with a goal of providing you with a solid foundation in using the GTL so that you can progress to more sophisticated, adaptable graphs as you need them. Ultimately, Getting Started with the Graph Template Language in SAS allows you to bypass the learning curve. It teaches you how to quickly create custom, aesthetically pleasing graphs that present your data with maximum clarity and minimum clutter.
 Parametry knihy
Zařazení knihy Knihy v angličtině Computing & information technology Business applications Mathematical & statistical software
- Plný název: Getting Started with the Graph Template Language in SAS
- Podnázev: Examples, Tips, and Techniques for Creating Custom Graphs
- Autor: Sanjay Matange
- Jazyk:
 Angličtina
 - Vazba: Brožovaná
- Počet stran: 186
- EAN: 9781612907123
- ISBN: 9781612907123
- ID: 08798117
- Nakladatelství: SAS Institute
- Hmotnost: 336 g
- Rozměry: 234 × 193 × 10 mm
- Datum vydání: 22. October 2013
Oblíbené z jiného soudku
-

LaTeX 2e
330 Kč -

TI-Nspire For Dummies 2e
471 Kč -
Discovering Statistics Using IBM SPSS Statistics
1748 Kč -

R For Dummies, 2e
945 Kč -

Data Mining with Rattle and R
2643 Kč -

R in Action
1477 Kč -

Advanced R, Second Edition
1589 Kč -

Hands-On Programming with R
936 Kč -

Statistics for Machine Learning
1397 Kč -

Applied Econometrics with R
2643 Kč -

Survival Analysis Using SAS
1940 Kč -

Beginner's Guide to R
2383 Kč -
Programming Graphical User Interfaces in R
5172 Kč -
Advanced SAS Interview Questions You'll Most Likely Be Asked
1097 Kč -

Using the TI-84 Plus
836 Kč -

System Zoo 1 Simulation Models - Elementary Systems, Physics, Engineering
464 Kč -
Base SAS Interview Questions You'll Most Likely Be Asked
1097 Kč -

SAS Interview Questions You'll Most Likely Be Asked
1495 Kč -

Scilab from Theory to Practice - I. Fundamentals
1367 Kč -

Handbook of Statistical Graphics Using SAS ODS
2501 Kč -
How to Use SPSS Syntax
725 Kč -
Using SPSS Syntax
2246 Kč -

Undocumented Secrets of MATLAB-Java Programming
7284 Kč -

Using Spss for Windows
852 Kč -
Understanding Statistics Using R
3362 Kč -

MATHEMATICA (R) Book, Version 4
3290 Kč -

Mastering Python for Finance
1259 Kč -

R Cookbook
1782 Kč -

Python Algorithms
3017 Kč -

Linear Mixed-Effects Models Using R
3017 Kč -

R Packages
1027 Kč -

Exploring University Mathematics with Python
2112 Kč -
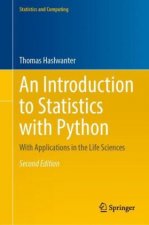
Introduction to Statistics with Python
3017 Kč -

Text Analysis with R
2720 Kč -

Mathematica Cookbook
1922 Kč -

Data Analysis with R
1259 Kč -
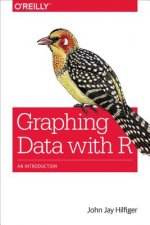
Graphing Data with R
909 Kč -

Problem Solving and Data Analysis Using Minitab
2755 Kč -
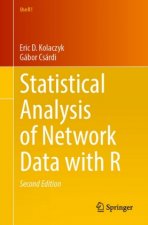
Statistical Analysis of Network Data with R
2571 Kč -

Practical Data Analysis -
1564 Kč -

Programming for Computations - Python
1830 Kč -

Data Analysis and Graphics Using R
3486 Kč -

MATHEMATICA (R) Book, Version 3
1285 Kč -

Step-by-Step Guide to SPSS for Sport and Exercise Studies
2455 Kč -

Beginner's Guide to Mathematica Version 3
3066 Kč -

R in a Nutshell 2e
1778 Kč -

R in Action
1916 Kč -

SAS Programming
1736 Kč -

Programming for Computations - MATLAB/Octave
1830 Kč
Osobní odběr Praha, Brno a 12903 dalších
Copyright ©2008-24 nejlevnejsi-knihy.cz Všechna práva vyhrazenaSoukromíCookies


 Vrácení do měsíce
 571 999 099 (8-15.30h)