Kód: 09268791
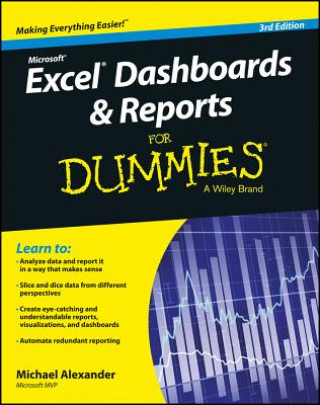
Excel Dashboards & Reports for Dummies
Autor Michael Alexander
Large corporations like IBM and Oracle are using Excel dashboards and reports as a Business Intelligence tool, and many other smaller businesses are looking to these tools in order to cut costs for budgetary reasons. An effective ... celý popis
- Jazyk:
 Angličtina
 - Vazba: Brožovaná
- Počet stran: 384
Nakladatelství: John Wiley & Sons Inc, 2016
- Více informací o knize

Mohlo by se vám také líbit
-

Excel Dashboards and Reports
930 Kč -
Statistics For Dummies, 2nd Edition
496 Kč -

Dashboards for Excel
3079 Kč -

Dashboarding and Reporting with Power Pivot and Excel
855 Kč -
Google Sketchup
817 Kč -

HBR's 10 Must Reads Boxed Set (6 Books) (HBR's 10 Must Reads)
2484 Kč -

Own the Arena
583 Kč -

Marvel novels - Thanos: Death Sentence
282 Kč -

Principles of Database Management
1857 Kč -

Stories from Montana's Enduring Frontier: Exploring an Untamed Legacy
750 Kč -
![Turkey. [A Sketch.] Turkey. [A Sketch.]](https://media.libris.to/jacket/07987153t.jpg)
Turkey. [A Sketch.]
854 Kč -

Blogs
1026 Kč -

Blogs and Tweets, Texting and Friending
1251 Kč -

Tarot dobra
452 Kč
Informovat o naskladnění knihy
Zadejte do formuláře e-mailovou adresu a jakmile knihu naskladníme, zašleme vám o tom zprávu. Pohlídáme vše za vás.
Více informací o knize Excel Dashboards & Reports for Dummies
 Anotace knihy
Large corporations like IBM and Oracle are using Excel dashboards and reports as a Business Intelligence tool, and many other smaller businesses are looking to these tools in order to cut costs for budgetary reasons. An effective analyst not only has to have the technical skills to use Excel in a productive manner, but must be able to synthesize data into a story, and then present that story to help make a decision. Microsoft shows its recognition of this need through Excel. In Excel, there is a major focus on business intelligence and visualization. "Excel Dashboards and Reports For Dummies, 3rd Edition" fills the gap between handling data and synthesizing data into meaningful reports. It offers quick and accessible information to show readers how to think about their data in ways other than columns and rows. What are the most meaningful ways to show trending? How do you show relationships in data? When is showing variances more valuable than showing actual data values? How do you deal with outliers? How do you bucket data in the most meaningful way? How do you show impossible amounts of data without inundating your audience? In "Excel Reports and Dashboards For Dummies," "3rd Edition, " readers will get answers to all of these questions. Part technical manual, part analytical guidebook, this title will help Excel users go from reporting data with simple tables full of dull numbers to creating hi-impact reports and dashboards. This book offers a comprehensive review of a wide array of technical and analytical concepts that will help users create meaningful reports and dashboards. After reading this book, the reader will be able to: * Analyze large amounts of data and report their data in a meaningful way * Get better visibility into data from different perspectives * Quickly slice data into various views on the fly * Automate redundant reporting and analyses * Create eye-catching visualizations * Create impressive dashboards and What-If analyses
 Parametry knihy
Zařazení knihy Knihy v angličtině Computing & information technology Business applications
- Plný název: Excel Dashboards & Reports for Dummies
- Autor: Michael Alexander
- Jazyk:
 Angličtina
 - Vazba: Brožovaná
- Počet stran: 384
- EAN: 9781119076766
- ISBN: 1119076765
- ID: 09268791
- Nakladatelství: John Wiley & Sons Inc
- Hmotnost: 522 g
- Rozměry: 190 × 236 × 23 mm
- Datum vydání: 26. February 2016
Oblíbené z jiného soudku
-

Code Complete
1107 Kč -

Blender For Dummies
910 Kč -

Pathfinder RPG Bestiary 3 Pocket Edition (P2)
616 Kč -

GDB Pocket Reference
420 Kč -

NetSuite For Dummies
544 Kč -

Great ScrumMaster, The
907 Kč -

SQL All-in-One For Dummies, 3rd Edition
715 Kč -
Data Warehouse ETL Toolkit - Practical Techniques for Extracting, Cleaning, Conforming and Delivering Data
1212 Kč -

CompTIA Network+ Study Guide: Exam N10-008 5e
1384 Kč -

CCNA Cyber Ops SECFND #210-250 Official Cert Guide
1229 Kč -

Excel VBA
481 Kč -

Adobe Photoshop CC For Dummies
739 Kč -

123s of D&d (Dungeons & Dragons Children's Book)
443 Kč -

BIG Book of Animal Crossing
304 Kč -
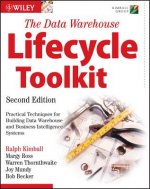
Data Warehouse Lifecycle Toolkit 2e
1310 Kč -

Salesforce.com For Dummies, 7th Edition
641 Kč -

CompTIA Security+ SY0-501 Exam Cram
1027 Kč -
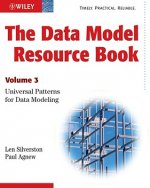
Data Model Resource Book - Universal Patterns for Data Modeling V3
2184 Kč -

Animated Storytelling
771 Kč -

Learning GNU Emacs 3e
878 Kč -

Complete Book of Pokemon
853 Kč -

Mastering AutoCAD 2021 and AutoCAD LT 2021
1401 Kč -

Joel on Software
910 Kč -

Android NDK: Beginner's Guide -
1532 Kč -

Think First
500 Kč -

LaTeX Beginner's Guide
1208 Kč -

WordPress Web Application Development -
1532 Kč -

MCSA 70-740 Cert Guide
1173 Kč -

Crystal Reports XI: The Complete Reference
1827 Kč -

Complete Guide to OneNote
1041 Kč -

Web Development with MongoDB and Node.js
1370 Kč -

OneNote
323 Kč -

Schnelleinstieg SAP Business Technology Platform (BTP) - Services und Integration
784 Kč -

Xamarin Cross-platform Application Development -
1260 Kč -

Xamarin Mobile Application Development for Android -
1532 Kč -
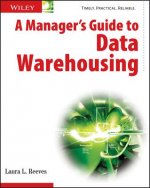
Manager's Guide to Data Warehousing
1669 Kč -

Scheduling in Distributed Computing Environment Using Dynamic Load Balancing
3178 Kč -

CompTIA PenTest+ PT0-001 Cert Guide
1535 Kč -

'TWAS
521 Kč -

Knight's Microsoft Business Intelligence 24-Hour Trainer
1097 Kč -

Ultimate Playstation Games Collection
614 Kč -

Microsoft Dynamics 365 Business Central Cookbook
1421 Kč -

MUTANT EPOCH RPG
765 Kč -

Bitcoin For Dummies
569 Kč -

Mastering Business Intelligence with MicroStrategy
1831 Kč -

PITFORD GATEWAY TO THE RUINS
718 Kč -

MALL OF DOOM
496 Kč -

Dynamic Management Views
866 Kč -

Mastering Ansible -
1370 Kč
Osobní odběr Praha, Brno a 12903 dalších
Copyright ©2008-24 nejlevnejsi-knihy.cz Všechna práva vyhrazenaSoukromíCookies


 Vrácení do měsíce
 571 999 099 (8-15.30h)